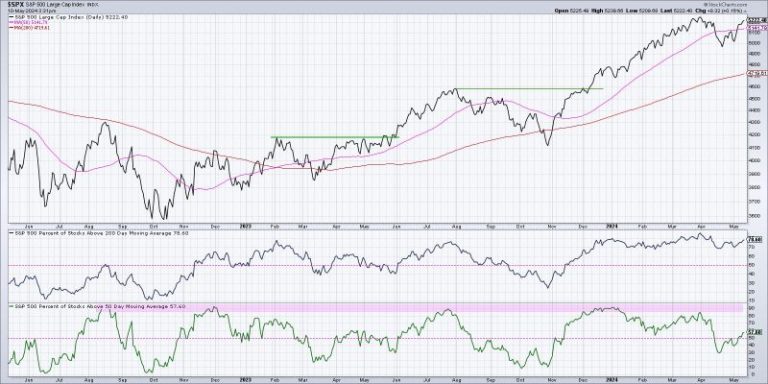
Breadth indicators are crucial tools that help investors and traders gauge the overall health and strength of the market. These indicators assess the underlying breadth of the market by analyzing the number of advancing and declining stocks or the volume of trading activity. By understanding breadth indicators, investors can confirm a bullish market trend and make more informed investment decisions. In this article, we will delve into three key breadth indicators that can help confirm a bullish market trend.
1. Advance-Decline Line (AD Line):
The Advance-Decline Line is a popular breadth indicator that tracks the number of advancing and declining stocks in the market. It is calculated by taking the difference between the number of advancing stocks and declining stocks each day and adding this value to the previous day’s AD Line value. A rising AD Line indicates that a larger number of stocks are advancing compared to those declining, suggesting underlying strength in the market and a potential bullish trend.
Investors often use the AD Line to confirm the direction of the overall market. If the AD Line is trending upwards while the market indices are also rising, it indicates broad participation and confirms the bullish trend. Conversely, if the AD Line is declining while the market indices are rising, it may signal weakness in the market and a potential reversal in trend.
2. New Highs-New Lows:
The New Highs-New Lows indicator compares the number of stocks hitting new highs versus those hitting new lows within a specific period. A high number of new highs relative to new lows is considered bullish, indicating that there is strength in the market as more stocks are reaching new highs. Conversely, a high number of new lows compared to new highs suggests weakness in the market and a potential bearish trend.
By monitoring the New Highs-New Lows ratio, investors can confirm a bullish market trend when the number of new highs consistently outweighs new lows. This indicates that there is strong buying interest in the market, driving stock prices higher and supporting the overall uptrend.
3. Volume Confirmation:
Volume is another crucial breadth indicator that can help confirm a bullish market trend. When prices are rising on increasing volume, it suggests that there is strong demand for stocks, supporting the uptrend. On the other hand, declining prices on high volume may indicate distribution and potential weakness in the market.
Investors should pay close attention to the volume accompanying market moves to confirm the strength of the trend. A rising market accompanied by high volume is typically seen as a positive sign, indicating broad participation and conviction among market participants. Conversely, a market rally on low volume may lack conviction and could be vulnerable to a potential reversal.
In conclusion, breadth indicators play a vital role in confirming a bullish market trend by assessing the overall health and strength of the market. By analyzing indicators such as the Advance-Decline Line, New Highs-New Lows, and Volume Confirmation, investors can gain valuable insights into market breadth and make more informed investment decisions. By incorporating these breadth indicators into their analysis, investors can navigate the markets more effectively and capitalize on bullish trends.


