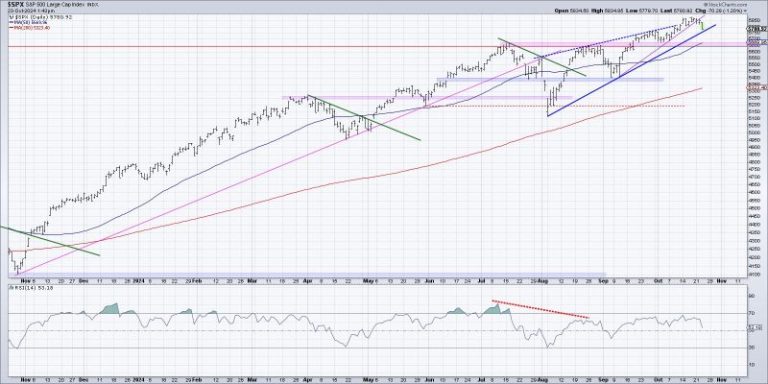
Visualizing the start of a potential distribution phase in the stock market can be a key tool for investors to anticipate future market movements and make informed decisions. There are several effective ways to visually understand and analyze this critical phase in the market cycle, which can help investors navigate potential risks and opportunities.
1. Volume Analysis:
One of the primary indicators to utilize when visualizing the start of a distribution phase is volume analysis. By studying the trading volume of a specific stock or index, investors can identify increasing or decreasing patterns that may signal a shift in market sentiment. During a distribution phase, a decrease in trading volume may indicate that institutional investors are gradually selling off their positions, leading to a potential downturn in the market. Conversely, a sudden spike in volume could signify higher interest and participation from retail investors, which might indicate a continuation of the bullish trend.
To visualize volume changes, investors can use volume bars on price charts or specialized technical indicators such as the Volume Weighted Average Price (VWAP) or On-Balance Volume (OBV). These tools provide a visual representation of buying and selling pressure, helping investors gauge the strength of a potential distribution phase.
2. Price Patterns:
Analyzing price patterns is another effective way to visualize the start of a distribution phase in the stock market. Distribution phases are often characterized by a series of lower highs and lower lows after a prolonged uptrend. Investors can use technical analysis tools such as trendlines, moving averages, and chart patterns like head and shoulders or double tops to identify potential reversal signals.
By examining the price action and identifying key support and resistance levels, investors can visualize the formation of a distribution phase and prepare for a potential market correction. Additionally, monitoring the behavior of key market indices and sector rotations can provide valuable insights into broader market trends and help investors anticipate distribution phases across different asset classes.
3. Market Breadth Analysis:
Monitoring market breadth indicators can offer a holistic view of the market’s health and help investors visualize the underlying strength or weakness during a distribution phase. Breadth indicators, such as the advance-decline line, new highs and new lows, or the percentage of stocks above their moving averages, can reveal the participation levels across different market sectors and individual stocks.
During a distribution phase, a divergence between market indices and market breadth indicators may signal underlying weakness and a potential market top. By visualizing these breadth indicators alongside price charts, investors can gain a comprehensive understanding of market dynamics and identify early warning signs of a distribution phase.
In conclusion, visualizing the start of a potential distribution phase in the stock market requires a combination of volume analysis, price patterns, and market breadth analysis. By utilizing these visual tools effectively, investors can enhance their market analysis and make well-informed decisions to navigate market cycles successfully. Staying vigilant and proactive in identifying distribution phases can help investors protect their portfolios and capitalize on emerging opportunities in the market.


