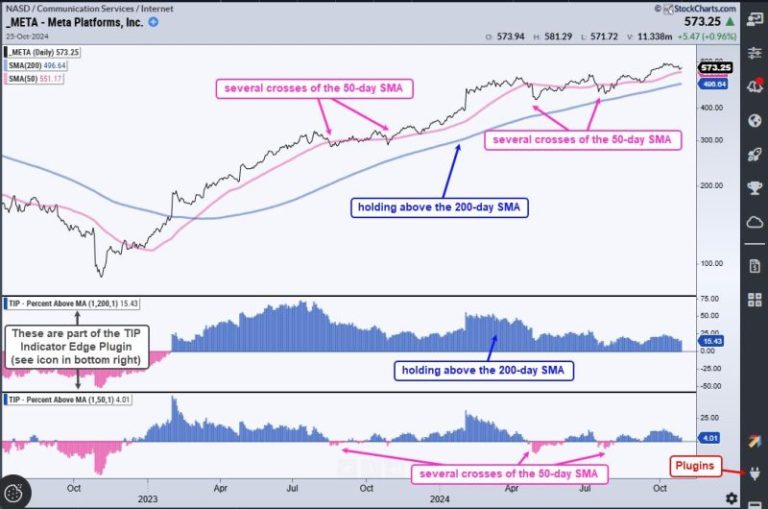
In the fast-paced world of trading and investing, having an edge is crucial to success. An edge gives you an advantage over other market participants, allowing you to make informed decisions and increase your chances of profitability. While there are many factors that can contribute to gaining an edge in the financial markets, two key indicators stand out as powerful tools for improving your edge: price action and volume analysis.
Price Action Analysis:
Price action analysis is a method of interpreting and understanding the movement of an asset’s price on a chart. By studying price patterns, trends, and key levels, traders can gain valuable insights into market sentiment and potential future price movements. Price action analysis is based on the premise that price movements reflect all available market information, making it a valuable tool for making trading decisions.
One key concept in price action analysis is support and resistance levels. Support levels indicate a price point where buying interest is strong enough to prevent the price from falling further, while resistance levels signify a price point where selling pressure is strong enough to prevent the price from rising higher. By identifying these levels on a chart, traders can anticipate potential price reversals and plan their trades accordingly.
Another important aspect of price action analysis is the study of candlestick patterns. Candlestick patterns provide valuable information about market sentiment and can help traders predict potential price reversals or continuations. Patterns such as doji, hammer, and engulfing patterns are commonly used by traders to identify potential entry and exit points in the market.
Volume Analysis:
Volume analysis is the study of the number of shares or contracts traded in a particular asset over a given period. Volume is an essential indicator in technical analysis as it provides insights into the strength and validity of price movements. High volume during a price breakout, for example, can confirm the strength of the trend, while low volume during a price reversal may indicate a lack of conviction among market participants.
One key concept in volume analysis is volume confirmation. Volume confirmation occurs when trading volume supports the direction of the price movement, validating the strength of the trend. When price and volume move in the same direction, it provides traders with a higher level of confidence in their trading decisions.
In addition to volume confirmation, traders also use volume indicators such as the volume-weighted average price (VWAP) to analyze intraday price movements and identify potential entry and exit points. VWAP is a valuable tool for day traders as it provides a reference price based on volume, allowing traders to gauge the average price at which a particular asset has traded throughout the day.
By incorporating price action and volume analysis into your trading strategy, you can improve your edge in the financial markets and make more informed trading decisions. These two indicators provide valuable insights into market sentiment, potential price movements, and trend strength, giving you a competitive advantage over other market participants. By mastering price action and volume analysis, you can enhance your trading skills and increase your profitability in the ever-changing world of finance.


