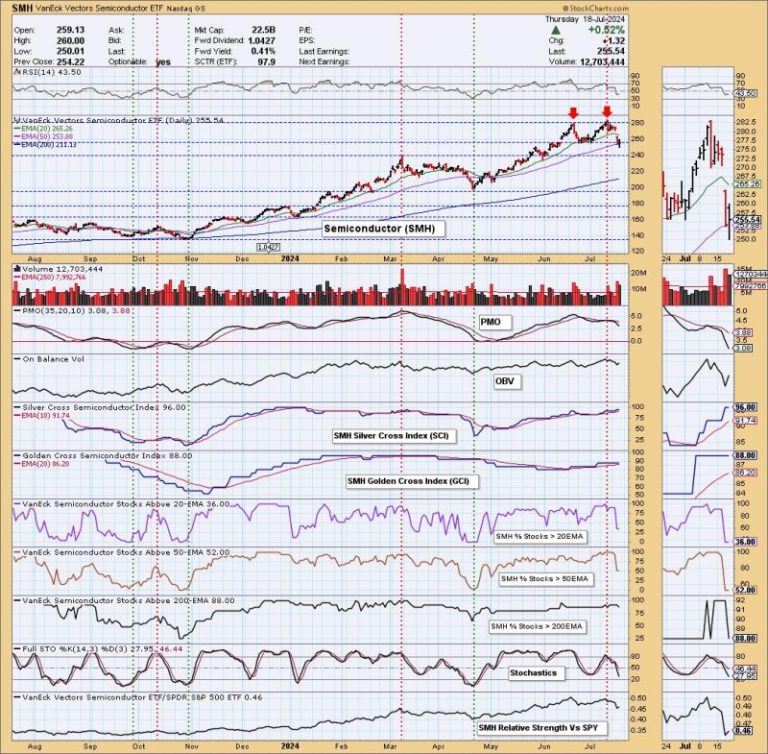
In the fast-paced world of finance, the concept of chart patterns serves as a valuable tool for technical analysts to assess potential market trends. One such pattern that has caught the attention of many traders recently is the double top pattern observed in the semiconductors sector, particularly within the SMH (VanEck Vectors Semiconductor ETF). This pattern typically indicates a potential trend reversal from bullish to bearish, providing insights into possible future price movements.
### Understanding the Double Top Pattern
The double top pattern is a bearish reversal pattern that forms after a significant upward price movement. It consists of two peaks that reach a similar high level, separated by a temporary trough known as the neckline. In the context of the SMH ETF, this pattern suggests that the index or stock in question may have reached a resistance level that is causing the price to stall and potentially reverse course.
### Significance of the SMH Double Top Pattern
The observation of a double top pattern in the semiconductors sector holds particular significance due to the influential role that semiconductor companies play in various industries, from technology to telecommunications. The SMH ETF, which tracks the performance of major semiconductor companies, is often seen as an indicator of broader market trends.
If the double top pattern in the SMH ETF persists and follows through with a confirmed breakdown below the neckline, it could signal a shift in investor sentiment and potentially lead to a bearish trend in the sector. This could have ripple effects on related industries and even impact overall market indices.
### Implications for Traders and Investors
For traders and investors actively involved in the semiconductor sector, recognizing the potential formation of a double top pattern in the SMH ETF can serve as a warning sign to reassess their positions and risk management strategies. It may prompt them to consider reducing exposure to semiconductor stocks or implementing hedging strategies to protect against potential downside risk.
Additionally, the confirmation of a breakdown below the neckline of the double top pattern could present trading opportunities for those looking to capitalize on a bearish move in the semiconductors sector. Shorting the SMH ETF or individual semiconductor stocks that exhibit similar patterns could be a viable strategy for traders seeking to profit from anticipated price declines.
### Conclusion
In conclusion, the emergence of a double top pattern in the SMH ETF has captured the attention of traders and investors alike, signaling a potential shift in the trajectory of the semiconductor sector. By understanding the significance of this pattern and its implications for market participants, individuals can better navigate market dynamics and make informed decisions regarding their investment strategies in the semiconductor industry. Stay vigilant, stay informed, and always be prepared to adapt to changing market conditions.


