The MACD Histogram: A Powerful Tool for Anticipating Trend Changes
The MACD histogram is a popular technical analysis tool used by traders to identify trend changes in financial markets. While the Moving Average Convergence Divergence (MACD) indicator itself is well-known for measuring the strength and direction of a trend, the MACD histogram takes it a step further by providing a visual representation of the difference between the MACD line and the signal line.
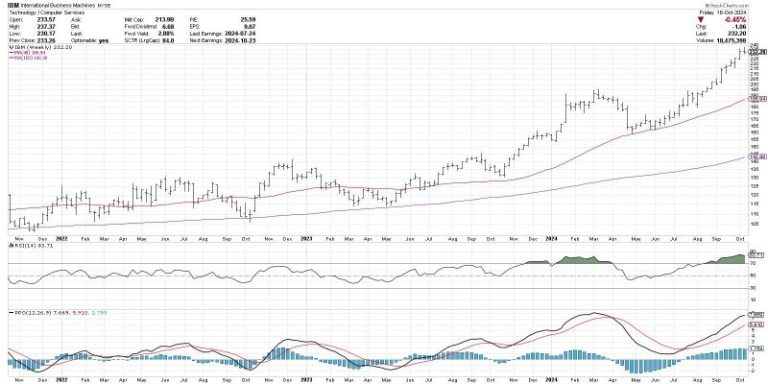
One of the key insights offered by the MACD histogram is its ability to anticipate trend changes before they become fully manifested in price movements. By analyzing the convergence or divergence between the MACD line and the signal line, traders can gain valuable insights into the momentum of a trend and potential turning points.
When the MACD histogram crosses above the zero line, it indicates a bullish momentum shift, suggesting that buying pressure is increasing and the trend may be reversing to the upside. Conversely, when the MACD histogram crosses below the zero line, it signals a bearish momentum shift, indicating that selling pressure is growing and the trend may be reversing to the downside.
Traders often look for confirmation signals in conjunction with the MACD histogram to strengthen their trade decisions. This can include observing price action, volume trends, and other technical indicators to validate the anticipated trend change identified by the MACD histogram.
It is important to note that while the MACD histogram can be a powerful tool for anticipating trend changes, like any technical indicator, it is not foolproof. False signals and whipsaws can occur, especially in choppy or ranging markets, so it is essential to use the MACD histogram in combination with other analysis tools to enhance its effectiveness.
In conclusion, the MACD histogram holds the potential to provide valuable insights into anticipating trend changes in financial markets. By leveraging its visual representation of momentum shifts and convergence/divergence patterns, traders can make more informed decisions and stay ahead of evolving market conditions. When used judiciously and in conjunction with other analysis tools, the MACD histogram can be a valuable asset in a trader’s toolkit for navigating the dynamic world of trading.


