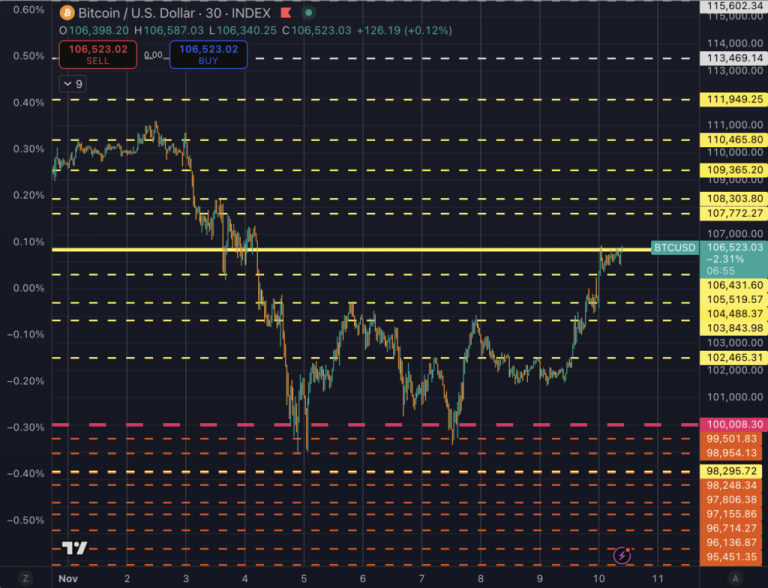
Bitcoin is back at $106,400, a pivot point that has been critical to this cycle’s rallies and pullbacks.
As we outlined in “Today’s $106k retest decided Bitcoin’s fate,” acceptance above this band has tended to unlock the next level. At the same time, rejection has forced a rebuild below a fair-value axis that acts as both support and resistance, depending on the flows and positioning.
As we outlined in “Today’s 106k retest decided Bitcoin’s fate,” the $106,400 band is this cycle’s fair-value axis, a support and resistance (S/R) pivot that has repeatedly organized trends.
Acceptance (after a retest) is typically bullish, usually unlocking the next shelf; rejection forces a rebuild to the lower level.
That dovetails with my previous analysis, “The bear market cycle started at 126k,” which argues that the burden of proof now lies with flows and skew, without a 5- to 10-day streak of net ETF creations, a visible skew pivot toward calls. Ultimately, a hold above about $126,272, the market should treat rallies as distribution.
In short, if $106.4k is flipped, the bull extends toward $114k to $120k; if it fails, the $126k-top framework remains in control, reopening at 100k to the high-90ks.
The tape case rests on whether fresh demand actually arrives.
Bitcoin investment products experienced roughly $946 million in net outflows during the week to November 3, following heavy inflows the previous week. That kind of flow whiplash is not the 5-to-10-day creation streak we set as the opposite-case checklist.
Daily flow prints across the United States spot ETF complex have been mixed and choppy, according to Farside’s dashboard, with one-off creation days failing to build momentum. When the burden of proof lies with the flow, streaks matter more than single prints, and so far, the data show inconsistent demand.
Derivatives positioning adds a second gate. Options open interest on Deribit reached a record of nearly $50.27 billion on October 23, with notable put interest clustered around $100,000. Elevated open interest changes how dealers hedge, often pinning prices near round strikes and capping upside until the skew flips from put-bid to call-bid.
Without that pivot in 25-delta skew, and without a sustained expansion in spot volume alongside creations, price tends to fade back toward the fair-value axis rather than building a platform above it.
The level map is straightforward and mechanical.
A clean daily close, followed by a weekly close, above $106,400 to $108,000, would convert the band from ceiling to support, which has historically released prices into the $114,000 range, then $117,000 to $120,000, where supply reappeared.
Confirmation comes from two to three consecutive net inflow days across the United States ETF set, a flattening of skew toward calls, and real spot follow-through. If those conditions expand to a 5- to 10-day creation streak, the path opens to prior high-volume nodes above $120,000 before the next decision.
Failure appears as a clean intraday stab over the pivot that slips back into the close, or a lower high beneath it, while ETF flows remain net negative and skew leans put-bid again. That sequence keeps the $126,000 top framework in control.
The path of least resistance becomes $103,000, then $100,000, with a break reopening the high-$90,000s. This is consistent with prior pivot-loss repair phases around the same axis, where failed reclaims forced price to rebuild structure below until flows and skew turned.
There is also the range case.
With open interest heavy and dealers sensitive to gamma around the $100,000 and $110,000 dollar strikes, pinning between $102,000 and $109,000 is a reasonable near-term outcome if the ETF prints fail to string together and the skew oscillates.
That setup bleeds volatility and creates false breaks around $106,400, which keeps the burden on structural demand to resolve the range. Single-day outflow spikes of nearly $500 million in late October are examples of headline risk that move prices without shifting the regime, a pattern that tends to unwind once the tape returns to its axis.
The halving-clock and cycle math keep the broader frame intact. If $126,000 stands as the peak printed in early October, the gain over the 2021 high sits near 82 percent, which fits a diminishing returns profile that we mapped to prior cycles, even if it lands slightly above a straight-line decay.
That timing lens aligns with the idea that the bear cycle began at $126,000, and that invalidation requires more than price tapping a line. It requires proof from the plumbing, meaning sustained creation and a durable skew pivot, then a hold above $126,272 to open, ranging from $135,000 to $155,000 before distribution resumes.
Quant guardrails help ensure the subsequent tests are accurate.
We flagged an eighth approach to $106,400, which is uncommon for a level that has held this long. Historically, repeated retests erode support or resistance until a decisive break forces repricing.
Setups like this reward a rules-based approach, where acceptance or rejection dictates positioning and risk, rather than a narrative that assumes the level will continue to work. The same discipline applies to flows, where a green day without follow-through does not meet the 5- to 10-day bar that defines a structural bid.
Macro will modulate the tape, but the triggers remain local. A back-up in yields or a firmer dollar tends to pressure risk and validate failed reclaims, while easing financial conditions tend to aid Scenario A.
Those are secondary toggles following ETF creations and options skew, which carry the proximate burden for this market, given the size of passive spot demand and the concentration of options positioning at round strikes. The flow path has to change before the price path can extend beyond the known shelves.
If $106,400 is reclaimed with a two-to-three-day ETF inflow streak, $114,000 to $120,000 returns to the deck.
If the pivot rejects while the next weekly ETF print shows net outflows, the $126,000 top framework drives the next leg lower. If skew stays put-heavy into expiry, derivatives gravity will keep price pinned beneath the pivot until that burden of proof flips.
The chart draws the lines, but flows and skew pull the trigger. Without a 5- to 10-day run of net creations, a visible skew toward calls, and a hold above approximately $126,272, rallies are considered distribution, and $100,000 comes back into view.
The post Bitcoin at critical test: If BTC breaks above $106k, bear market could be postponed appeared first on CryptoSlate.


